Virginia Tech researchers unveil precision technology for spring dead spot control in bermudagrass
We are exploring precision turfgrass management at Virginia Tech University and have completed a project utilizing new technology for targeted spring dead spot (SDS) management in bermudagrass. SDS is a highly destructive disease affecting bermudagrass in the U.S. Transition Zone caused primarily by Ophiosphaerella korrae and O. herpotricha. These fungi infect bermudagrass in the fall, with symptoms appearing in the spring. The disease causes patches of necrotic turfgrass that often reoccur and expand, and traditional chemical control methods are costly and inconsistent.
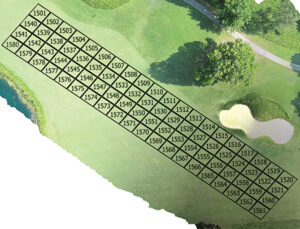
(Fig. 1) Plots overlaid onto spring dead spot incidence maps in QGIS software for analysis. (Photo: Virginia Tech University)
Historically, superintendents applied fungicides broadly across all fairways, teeing grounds and green surroundings in the fall, requiring large amounts of fungicide. Turfgrass managers are left with three options: use expensive, effective fungicides; cheaper, less effective fungicides or no fungicides and manage recovery in the spring. Due to fungicide costs and golfer expectations, these options may be unsatisfactory for some courses.
Advances in technology now allow for easier mapping and documentation of SDS symptoms to guide targeted applications. Precision Turfgrass Management (PTM) adopts principles from precision agriculture, such as using unmanned aerial vehicles (UAV) and site-specific management of nutrition and pests. This approach aims to improve input efficiency and minimize environmental impacts.
Materials and methods
We collected aerial imagery on May 16, 2016, May 18, 2017 and May 7, 2018, from three Vamont hybrid bermudagrass fairways at the Country Club of Virginia’s Tuckahoe Creek Golf Course in Richmond, Va. We mowed fairways three times per week when actively growing at a height of cut of 0.5 inches. Certificated remote pilots performed unmanned aerial vehicle flights to collect aerial imagery.
The treatment areas were three fairways with a history of SDS outbreaks, each designated as a single location. Collecting digital imagery from 11 a.m. and 2 p.m. local time minimized issues with dew, leaves, people, vehicles, grass clippings and shading. We selected 30 SDS patches to represent each location’s spatial variability and used them to ground-truth the aerial maps.
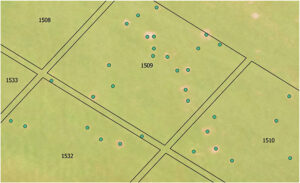
(Fig. 2) Plot 1509 (Location 15, Plot 9) in QGIS with points assigned to spring dead spot patches to count infection center incidence. Assigned points can be counted per plot or location to develop GPS-guided spray maps. (Photo: Virginia Tech University)
Ground validation
We captured the spectral reflectance of the SDS patches using a Crop Circle 470 (Holland Scientific) with geo-referenced GPS coordinates assigned to each patch. We also collected measurements of healthy turfgrass for comparison from portions of the fairway void of SDS.
After ground truthing SDS patches, we overlaid geolocations onto aerial maps in Quantum GIS (QGIS) using GPS data to confirm the spectral characteristics of SDS patches and healthy turfgrass on the aerial maps. We used differences in spectral data between healthy turfgrass and ground-truthed SDS patches to validate voids in the turfgrass as symptoms of SDS on aerial maps.

Spray map (clipped) to illustrate the GPS-guided spray maps built in QGIS and used in 2017 with the Toro 5800 GeoLink sprayer. (Photo: Virginia Tech University)
Processing and analysis
We stitched the imagery together using PhotoScan Pro software, and the images were geospatially analyzed using QGIS. The SDS incidence maps were rectified with ground-truth GPS data created as a separate point shapefile for spatial accuracy within QGIS. We created polygons and clipped them to represent the research plots laid out in the field to make a grid overlaid in QGIS for analysis.
After image processing, we subjected the clipped individual plots to digital image analysis (DIA) using various ratios of red, green and blue digital values in QGIS. The following equation was the most successful at differentiating SDS from healthy bermudagrass: for a given pixel, if (red+blue)/green > 1.7, that pixel represents SDS. The number of pixels in each plot representing SDS was divided by the number of pixels in the entire plot to give a percentage of SDS in the plot.
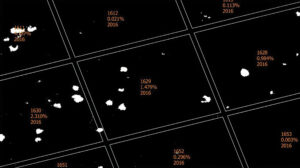
(Fig. 4) Digital image analysis in QGIS to analyze diseased areas per plot at Location 16 in 2016. (Photo: Virginia Tech University)
Experimental design
The study was conducted across three unique fairways, each with a history of SDS and varying severity and geographic distribution of SDS clusters. At each fairway location, 20 replications of four treatments were completely randomized. Disease incidence maps, created with aerial imagery collected in spring, were used to overlay plots in QGIS for evaluation (Figure 1). We counted and ranked SDS patches before treatment, with incidence ranging from zero to 39 patches per plot. Treatments were randomized within the disease severity class to ensure even treatment distribution.
Treatments included:
- A nontreated control
- Tebuconazole at 1.1 lbs. per acre across the entire plot
- Penthiopyrad at 1.9 lbs. per acre across the entire plot
- Targeted penthiopyrad at 1.9 lbs. per acre based on historical disease incidence
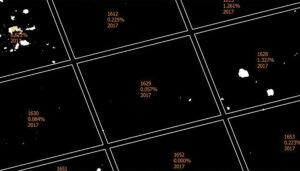
(Fig. 5) Digital image analysis in QGIS to analyze diseased areas per plot at Location 16 in 2017 post treatments. (Photo: Virginia Tech University)
We initiated treatments in the fall when soil temperatures dropped below 70 degrees F for three consecutive days. In 2016, Treatment 4 plots were subdivided into three sections for left, center and right boom widths. SDS patches were counted in each subplot to determine disease severity, and fungicide was applied if the incidence exceeded two patches.
In 2017, we used an individual nozzle-controlled sprayer to make targeted applications in Treatment 4. A point layer shape file was created in QGIS for Treatment 4, representing each SDS patch (Figure 2). Using QGIS’ buffering tool, a radial buffer was established around each SDS point to make the targeted spray map (Figure 3). We downloaded these maps to the sprayer’s onboard computer for precise applications with no overlap.
We laid out plots manually before treatment application, and the sprayer was calibrated to deliver 87 gallons per acre. We applied fungicides preventatively in the fall to assess activity against spring symptom development. Initial applications for 2016-2017 occurred on Sept. 26, 2016, with repeats on Oct. 17, 2016. For 2017-2018, applications started on Sept. 18, 2017 and repeated on Oct. 17, 2017.
Data analysis
We analyzed disease incidence maps for 2016, 2017 and 2018 using manual patch counts (Figure 2) and digital image analysis (DIA, Figures 4 and 5). DIA provided the percent disease per plot, which was converted to diseased area per unit area (mm2 m-2).
We analyzed data for treatment effects, location and treatment × location interaction. Analysis of variance (ANOVA) was used, and means were separated using Fisher’s LSD test. Pearson’s correlation test explained the relationship between aerial DIA and ground-truth validation.
 Results
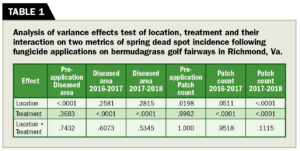
Before the study, we evaluated locations for SDS incidence. An analysis of the total number of patches (PC) and disease area (DA) per plot in 2016 indicates location effects but not for treatment or treatment × location effects (Table 1). This result shows that our known-bias treatment distribution at initial application successfully distributed disease incidence across replications.
Although there was no significant difference, PC was listed for 2016 (Table 2) to illustrate the even distribution of disease between treatments. Differences in disease incidence across locations agree with previous research that states a large amount of variability in SDS incidence and illustrates the random nature of the disease.
Diseased Area (DA)
Plot main effects of location and treatment × location interaction were insignificant in 2016–2017 or 2017–2018; therefore, treatment data were pooled across locations (Table 1). We did not pool data across years because application methods varied from subplot applications in 2016 to individual nozzle control in 2017.
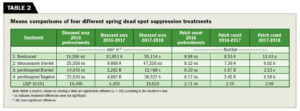 Blanket applications of tebuconazole were statistically similar to the nontreated control (Table 2). Targeted applications of penthiopyrad in 2016–2017 provided statistically equivalent suppression of SDS compared to blanket applications of penthiopyrad and had significantly lower DA than both the nontreated control and tebuconazole plots in 2017–2018. Targeted penthiopyrad applications in 2017 were less successful at suppressing DA from SDS symptoms in the spring of 2018 when compared to blanket penthiopyrad.
Patch Count (PC)
An analysis of the total number of patches per plot in 2016 (pre-application) and 2017–2018 revealed location effects (Table 1). Significant differences among treatments occurred in 2016–2017 and 2017–2018. However, there were no location × treatment differences in either year, so treatment means of PC were pooled across locations.
Plots treated with tebuconazole and the nontreated control were not statistically significant in 2016-2017 (Table 2). Plots treated with targeted penthiopyrad and as blanket applications had fewer SDS patches than plots treated with tebuconazole and the nontreated control in 2016–2017. However, blanket applications of penthiopyrad resulted in statistically fewer SDS patches than targeted penthiopyrad applications in 2017-2018.
In 2017–2018, tebuconazole and targeted penthiopyrad were not statistically significant and superior to the nontreated control, while blanket penthiopyrad provided superior SDS suppression compared to all other treatments.
 Conclusion
The results of this project suggest that site-specific management is a viable option for successful SDS suppression while reducing fungicide inputs. Still, methods need improvement in using GPS-guided sprayers with individual nozzle control. While the GPS-guided sprayer successfully provided control by applying the blanket and full-coverage treatments, the buffers selected for targeted application of penthiopyrad may not have been adequate to maximize SDS suppression.
Abiding by the principles of precision conservation, the targeted applications of penthiopyrad based on spatial variability of SDS were superior to the nontreated control in both years. Targeted penthiopyrad applications were equivalent to blanket, full-coverage applications of penthiopyrad in 2016–2017 and blanket, full-coverage applications of tebuconazole in 2018. Overall, the targeted penthiopyrad treatments resulted in a 51 percent reduction of fungicides applied in 2016 and a 65 percent reduction in fungicides in 2016–17 compared to the blanket treatments.
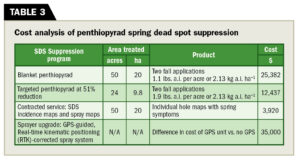
Further, we compared the cost of a blanket SDS suppression program vs. the costs associated with a targeted SDS suppression program (Table 3) on an average-sized golf course on tees, approaches and fairways. Pricing reflects two applications of penthiopyrad at the high label rate and the estimated price difference between a Toro 5800 Multi Pro sprayer and a Toro 5800 Multi Pro sprayer with GeoLink. Multiple manufacturers are capable of providing this technology.
When we consider targeted applications to larger areas with a GPS-guided sprayer similar to our methods in 2016, it is plausible that site-specific applications would be comparable to blanket applications. Using the numbers in Table 3, it would take three years of SDS suppression to see a return on the investment of the GeoLink upgrade using a targeted penthiopyrad SDS suppression program. However, this does not include additional savings incurred while using the GeoLink sprayer for other applications. Also, we estimate potential annual savings from improved precision and fuel and time savings ranging from 12 to 25 percent.
Acknowledgements
GCSAA and the Virginia Golf Course Superintendents Association’s Chapter Cooperative Grant provided financial support. Additionally, The Toro Company and Smith Turf & Irrigation provided financial and technical support. The authors thank UAV pilots and planners Andrew Morgan, Haseeb Chandra, and David Hunsucker. Finally, the authors thank the McCall, Askew, and Kochersberger labs at Virginia Tech for support, The Country Club of Virginia, David Rathke and Christian Sain for providing access to their golf course for this project, and Syngenta Crop Protection.
The article is adapted from Booth JC, McCall DS, Sullivan D, Askew SA, Kochersberger K. Investigating targeted spring dead spot management via aerial mapping and precision-guided fungicide applications. Crop Science, 2021;61:3134–3144. https://doi.org/10.1002/csc2.20623
Authors: Jordan Booth, Ph.D., USGA Green Section, Shawn Askew, Ph.D., David McCall, Ph.D. Kevin Kochersberger, Ph.D., Virginia Tech University, and Dana Sullivan, TurfScout LLC. For more information, contact Jordan Booth, Ph.D., Senior Director, Course Consulting Service, USGA, at jbooth@usga.org, Pinehurst, N.C.
References
Beard, J. B., & Kenna, M. P. (2008). Water quality and quantity issues for turfgrasses in urban landscapes. In Workshop on water quality and quantity issues for turfgrasses in urban landscapes (2006: Las Vegas, Nev.). (pp. 124–216). Council for Agricultural Science and Technology.
Bell, G. E., Kruse, J. K., & Krum, J. M. (2013). The evolution of spectral sensing and advances in precision turfgrass management. Turfgrass: Biology, use, and management, 56, 1151–1188.
Bora, G. C., Nowatzki, J. F., & Roberts, D. C. (2012). Energy savings by adopting precision agriculture in rural USA. Energy, Sustainability and Society, 2(1), 22. https://doi.org/10.1186/2192-0567-2-22
Butler, E. L. (2005). Development of novel strategies for control of spring dead spot in bermudagrass (Master’s thesis). North Carolina State University.
Carrow, R. N., Duncan, R. R., & Huck, M. T. (2008). Turfgrass and landscape irrigation water quality: Assessment and management. CRC Press.
Carrow, R. N., Krum, J. M. & Flitcroft, I., & Cline, V. (2010). Precision turfgrass management: challenges and field applications for mapping turfgrass soil and stress, Precision Agriculture, 11, 115–34.
Caturegli, L., Corniglia, M., Gaetani, M., Grossi, N., Magni, S., Migli- azzi, M., Angelini, L., Mazzoncini, M., Silvestri, N., Fontanelli, M., Raffaelli, M., Peruzzi, A., & Volterrani, M. (2016). Unmanned aerial vehicle to estimate nitrogen status of turfgrasses. PLOS ONE, 11(6), e0158268. https://doi.org/10.1371/journal.pone.0158268
Delgado, J. A., Berry, J. K. & Khosla, R. (2008). New advances and practices for precision conservation. In Proceedings of the 9th International Conference on Precision Agriculture, Denver, CO, July 21– 23.
Earlywine, D., & Miller, G. L. (2018). Evaluation of Kabuto and Torque for preventative spring dead spot control on bermudagrass, 2016– 2017. Plant Disease Management Reports, 12, T025
Freund, D. R. Kerns, J. P., Butler, E. L., & Ploetz, J. N. (2019). Evaluation of fungicides for control of spring dead spot on a bermudagrass putting green, 2017–2018. Plant Disease Management Reports, 13, T005
Hutchens, W. J., Henderson, C. A., Bush, E. A., Kerns, J. P., & McCall, D.S. (2021). Geographic distribution of Ophiosphaerella species in the Mid-Atlantic United States. Plant Health Progress. https://doi.org/10.1094/PHP-04-21-0076-S
Iriarte, F. B., Todd, T. C., Tisserat, N. A., Fry, J. D., & Martin, D. L. (2005). Effect of cold acclimation and freezing on spring dead spot severity in bermudagrass. Hortscience, 40, 421–423. https://doi.org/10.21273/HORTSCI.40.2.421
Karcher, D. E., & Richardson, M. D. (2013). Digital image analysis in turfgrass research. Turfgrass: Biology, Use, and Management, 1133–1149.
Martinez, J. F. I., Flores, F. J., Koch, A. R., Garzon, C. D., & Walker, N. R. (2019). Multiplex end-point PCR for the detection of three species of Ophiosphaerella causing spring dead spot of bermudagrass. Plant Disease, 103, 2010–2014. https://doi.org/10.1094/PDIS-10-18-1727-RE
McCarty, L. B., & Miller, G. (2002). Managing bermudagrass turf: Selection, construction, cultural practices, and pest management strategies. John Wiley & Sons.
Patton, A. (2012). Warming up in the Transition Zone. Green Section Record, 50, 5.
Roberson, T. L., McCall, D. S., Estes, A., & Shelton, C. D., (2017). Novel Spring Dead Spot Control Using Isofetamid. ASA, CSSA, SSSA. https://scisoc.confex.com/crops/2017am/webprogram/Paper105999.html
Smiley, R. W., Dernoeden, P. H., & Clarke, B. B. (2005). Compendium of turfgrass diseases (3rd ed.). American Phytopathological Society.
Smith, D. L., & Walker, N. (2009). Spring dead spot of bermudagrass. Division of Agricultural Sciences and Natural Resources, Oklahoma State University.
Straw, C. M., & Henry, G. M. (2018). Spatiotemporal variation of site-specific management units on natural turfgrass sports fields during dry down. Precision Agriculture, 19(3), 395–420. https://doi.org/10.1007/s11119-017-9526-5
Throssell, C. S., Lyman, G. T., Johnson, M. E., Stacey, G. A., & Brown, C. D. (2009). Golf course environmental profile measures water use, source, cost, quality, management and conservation strategies. Applied Turfgrass Science, 6.
Tredway, L. P., Tomaso-Peterson, M., Perry, H., & Walker, N. R. (2009). Spring dead spot of bermudagrass: A challenge for researchers and turfgrass managers. Plant Health Progress, 10.
Trenholm, L. E., Duncan, R. R., & Carrow, R. N. (1999). Wear tolerance, shoot performance, and spectral reflectance of seashore paspalum and bermudagrass. Crop Science, 39(4), 1147–1152. https://doi.org/10.2135/cropsci1999.0011183X003900040033x
USGA Green Section (2016). Tremendous Savings from GPS Spray Technology. United States Golf Association. https://www. usga.org/course-care/water-resource-center/bmp-case-studies/tremendous-savings-from-gps-spray-technology.html
Watts, A. C., Ambrosia, V. G., & Hinkley, E. A. (2012). Unmanned aircraft systems in remote sensing and scientific research: Classification and considerations of use. Remote Sensing, 4, 1671–92. https://doi.org/10.3390/rs4061671
Walker, N. R., Mitchell, T. K., Morton, A. N., & Marek, S.M. (2006). Influence of temperature and time of year on colonization of bermudagrass roots by Ophiosphaerella herpotricha. Plant disease, 90(10), 1326–1330. https://doi.org/10.1094/PD-90-1326
Walker, N. R. (2009). Influence of fungicide application timings on the management of bermudagrass spring dead spot caused by Ophiosphaerella herpotricha. Plant disease, 93(12), 1341–1345. https://doi.org/10.1094/PDIS-93-12-1341
Zhang, C., & Kovacs, J. M. (2012). The application of small unmanned aerial systems for precision agriculture: A review. Precision Agriculture, 13, 693–712. https://doi.org/10.1007/s11119-012-9274-5
Zhang, J., Virk, S., Porter, W., Kenworthy, K., Sullivan, D., & Schwartz, B. (2019). Applications of unmanned aerial vehicle based imagery in turfgrass field trials. Frontiers in plant science, 10, 279. https://doi.org/10.3389/fpls.2019.00279


