Predicting dollar spot just got easier
As spring approaches, some especially devastating diseases once again rear their ugly heads. Argued to be the costliest disease of turfgrass worldwide, dollar spot will be on a lot of minds and in a lot of budgets. With warmer temperatures, our cool-season grasses become especially susceptible, and proactive management of this foliar disease is necessary to prevent severe damage.
Dollar spot is a particularly aggressive and destructive disease caused by the fungal pathogen Sclerotinia homoeocarpa. This fungus overwinters in plant tissues, quite often re-emerging in multiple epidemics throughout the year over the spring, summer and fall. The symptoms on highly maintained, closely mown turf typically consist of small, sprawling patches of bleached plants that are unsightly and can affect playability of putting greens or fairways. S. homoeocarpa stands out for its ability to acquire resistance relatively quickly to many fungicides, making long-term control strategies tricky at best.
The pathogen is ubiquitous and has many survival strategies, including colonizing seed and plant tissue during the winter months. Dollar spot management traditionally consists of frequent, calendar-based fungicide applications because the onset of disease can be unpredictable and epidemics ebb and flow during the season.
This management method quickly becomes problematic financially and biologically. Not only can these frequent applications strain budgets, but increased exposure of the pathogen to fungicides can promote fungicide resistance in the population. To combat these complications, a method of predicting disease development to avoid unnecessary fungicide applications would be an extremely valuable tool for superintendents.
The Smith-Kerns Dollar Spot Prediction Model
Fortunately, S. homoeocarpa relies on specific weather conditions for infection and subsequent epidemics. Uncovering and monitoring the relationship between weather and disease development has allowed researchers to create a helpful tool to use fungicides more effectively. By spraying only when weather has made an outbreak more likely, superintendents may reduce the number of yearly sprays. This may ease some financial burden associated with recurring epidemics. More importantly, such a tool should lessen the risk of the fungal population developing resistance as unnecessary exposures are avoided.
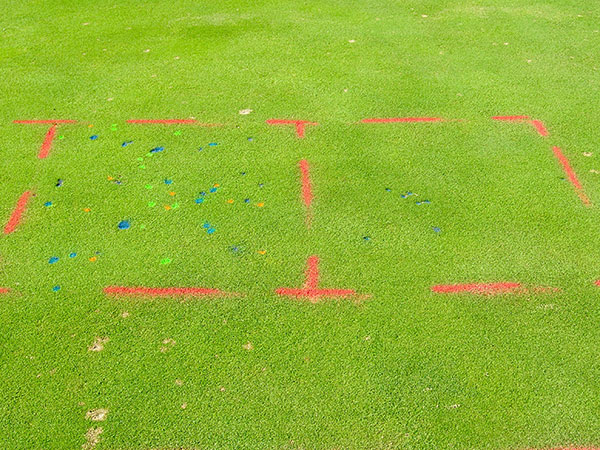
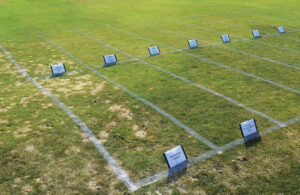
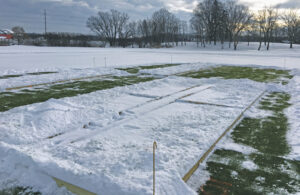
Figure 1
This image depicts how the model initially was developed at Oklahoma State University and the University of Wisconsin-Madison. Each day, dollar spots were counted and painted with a color corresponding to the day of the week. These data were used to correlate disease development to various weather parameters.
Damon Smith, Ph.D., and Jim Kerns, Ph.D., developed a model that can more appropriately pinpoint application timing based on recent weather conditions. This model originated with Smith when he was at Oklahoma State University. His expertise is in the development of predictive and spray-advisory models for plant diseases. Initially, Smith and Kerns established plots in Oklahoma and Wisconsin to create a database to develop weather-based models that explain dollar spot development. To do this, plots were established and weather stations installed near the plots. Dollar spots were counted each day and painted to avoid counting the same spots on subsequent days (Figure 1). Smith and Kerns used statistics and their knowledge of fungal biology and epidemiology to develop models to predict the occurrence of dollar spot foci that can help time fungicide applications. What resulted was the first iteration of the Smith-Kerns Dollar Spot Prediction Model.
The model is a logistic regression using five-day moving averages of daily average air temperature and relative humidity to predict the likelihood of dollar spot symptom development. Using these data, the Smith-Kerns Model determines the probability that new dollar spots will form on a given day. However, this model does not tell the superintendent when to spray, since there are numerous site-specific factors (grass cultivar, air movement, fertility, irrigation, etc.) that affect the onset of symptoms. Instead, superintendents need to set the model spray threshold appropriate for their course. This threshold is the chosen probability at which the user will make applications, which means the model is adaptable for different micro-environments. However, choosing an individual threshold may require a little experimentation.
Establishing probability thresholds
Research carried out at Wisconsin established an effective threshold of 20-percent probability, which users can tweak until it’s most efficient for a particular situation. This original threshold was determined from Penncross creeping bentgrass (Agrostis stolonifera L.) in a more northern climate, so thresholds chosen across other locations may differ (Figure 2). This threshold value worked well in numerous climates, including Pennsylvania, New Jersey, Oklahoma, Mississippi and Tennessee. However, turfgrass managers can adjust the threshold based on cultivar, location and amount of risk they are willing to accept. The 20-percent threshold worked as well as applying fungicide every two weeks through the summer months, and normally resulted in saving one to two fungicide applications.
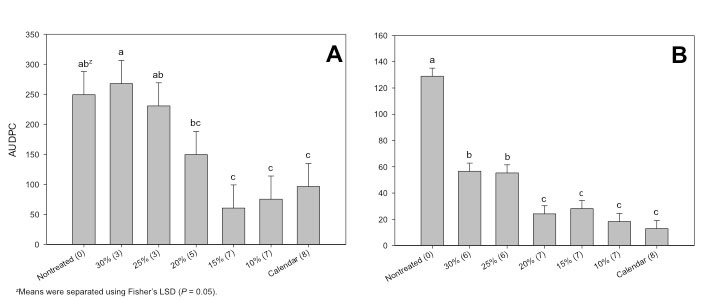
Figure 2
This figure shows variability in disease control with different thresholds in the Smith-Kerns Dollar Spot Prediction Model. Each graph represents a different year. AUDPC stands for area under the disease progress curve and is a summary of disease intensity over time. Notice in graph A that the 20-percent threshold worked well and saved fungicide applications, but in the subsequent year did not save as many fungicide applications. These thresholds were developed for Penncross creeping bentgrass and can be adjusted according to expectations and cultivar.
Once you’ve determine a threshold, spraying is appropriate any time the threshold is met. Once you’ve sprayed and you know your interval of expected suppression, another application is not necessary until the suppression interval is met and the advisory predicts onset of disease. At the end of the suppression interval, revisit the model. If the threshold is met on the day the spray interval has passed, another fungicide application is in order. If the threshold has not been met, spraying is not necessary (Figure 3). This way, you could reduce applications or extend the period between some fungicide applications.

Figure 3
This figure depicts how the Smith-Kerns Model works in practice. The length of residual control is determined by the product used and from the expectation of the golf course superintendent.
Conveniently for users of the model, multiple online tools are available to calculate dollar spot-event probabilities. Paul Koch, Ph.D., at the University of Wisconsin-Madison has compiled a thorough page on his lab’s website outlining model details, providing links to online tools and offering downloads of easy-to-use Excel spreadsheets for both Fahrenheit and Celsius temperatures.
The downloaded spreadsheet will appear with numbers already populated (once opened), demonstrating its utility and making it easy to follow and adjustable for the individual user. For each day, average relative humidity and the daily high and low temperatures are all you need to calculate dollar spot probability with the Smith-Kerns Model.
This example illustrates that you use the first five days to create the running averages, so a probability of dollar spot occurrence will not be created with the Smith-Kerns Model until the fifth day of data. This doesn’t mean you have to wait for the spreadsheet to be helpful because obtaining this past data through any weather service makes this tool immediately useful to superintendents. There also are two sites from which you may access and use the Smith-Kerns Model: GDDTracker of Michigan State University and the GreenKeeper App from Bill Kreuser, Ph.D., at the University of Nebraska-Lincoln. The model also is available on uspest.org.
The point is eliminating applications
Based on the model work conducted in Wisconsin, Oklahoma and elsewhere, superintendents can expect to save a modest number of fungicide applications while maintaining the same level of disease control. A two-year study using the model at the O.J. Noer Turfgrass Research Facility in Madison, Wis. resulted in saving three fungicide applications in 2015 compared to a 21-day calendar program. In 2016 at the same location, a lengthier, more conducive season for dollar spot, only one fewer fungicide application was achieved. As with most things in turfgrass management, weather controls our actions, and the Smith-Kerns Dollar Spot Model is no different.
The model will not work unless temperatures are above 50 degrees F (10 degrees C) and below 95 degrees F (35 degrees F). Research demonstrates that dollar spot is most prevalent between these temperatures, therefore the model was amended to prevent false positives if relative humidity was conducive but temperatures were not within this window.
From recent research, we know that the species Sclerotinia homoeocarpa may be redefined and distinguished as several different species. When this taxonomical adjustment occurs, we may be able to observe management differences among species that result in altered models based on dollar spot species. In this case, to provide even more precise prediction models, populations on individual courses can be tested and described in terms of which species are present in what proportions. This may be some time in the future, but possibilities exist for more efficient customized disease prevention.
When dealing with difficult populations of the pathogen S. homoeocarpa, spray programs that are calendar-based quickly can become costly and have a higher chance of promoting resistance to valuable fungicides. The Smith-Kerns Dollar Spot Prediction Model can limit these risks and costs by adjusting a spray program to account for the preferred weather patterns of disease development. With many intuitive online tools available to superintendents, this model is an easy and cost-effective addition to any fungicide program meant to protect against dollar spot.
Allison Anthony is a graduate student and Jim Kerns, Ph.D., is a turfgrass pathologist at North Carolina State University. Paul Koch, Ph.D., is a turfgrass pathologist and Damon Smith, Ph.D., is a field crop pathologist at the University of Wisconsin-Madison. You may reach Kerns at jpkerns@ncsu.edu for more information.
References
Smith, D.L., J.P. Kerns, N.R. Walker, A.F. Payne, B. Horvath, J.C. Inguagiato, J.E. Kaminski, M. Tomaso-Peterson, and P.L. Koch. 2018. Development and validation of a weather-based warning system to advise fungicide applications to control dollar spot on turfgrass. PlosOne https://doi.org/10.1371/journal.pone.0194216.
Koch, P.L. and Hockmeyer, K. Dollar Spot Model. https://tdl.wisc.edu/dollar-spot-model/
Photo by: Damon Smith
Subscribe to Golfdom

If you enjoyed this article, subscribe to Golfdom to receive more articles just like it.