Selecting appropriate sand-cap depths
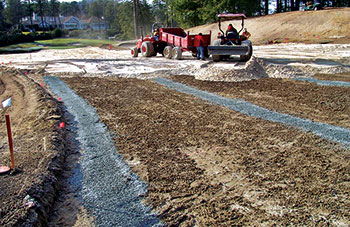
Placement of the sand cap above the soil. (Photo: Bert McCarty)
Poor drainage is a major concern for golf course superintendents. It can restrict play, which reduces income, potentially having a long-term negative financial impact on a course. Drainage problems are compounded by demands for perfect facilities and playability, while rainfall events are becoming less predictable and more intense.
The most efficient way to remove water from a golf course is through surface drainage. Most drainage is achieved this way.
However, sloping all fairways, greens and approaches detracts from aesthetics and playability. Alternatively, superintendents may use subsurface drainage, but this typically does not remove water as rapidly as surface drainage, and superintendents often must slope subgrades to provide the required elevation drop to suitable outlets.
Sand capping is a way to use a combination of surface and subsurface drainage. It is done by applying a relatively deep layer of sand on top of an existing turf area — such as a fairway — to improve drainage and playability while providing an acceptable root zone for turf growth.
A heavy topdressing beginning
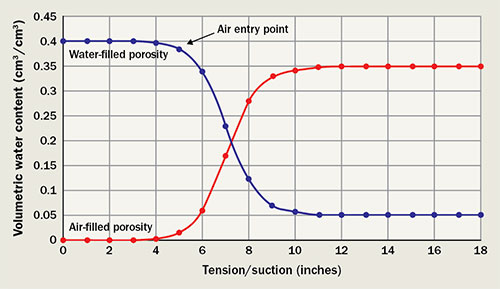
An example of a moisture-retention curve showing both water-filled porosity and air-filled porosity, as well the air entry point. One method of determining needed sand-capping depths is based on the air-filled porosity versus the severity of an anticipated rainfall event. Minimal sand-capping depth would be based on 10 percent air-filled porosity and medium capping based on 15 percent air-filled porosity, with 25 percent being the most conservative value. In this example, at 10-percent air-filled porosity, an approximately 6.5-inch cap is suggested, followed by an approximately 7-inch depth at 15-percent air-filled porosity and 7.5 inches for 25 percent porosity. One obviously has to weigh historic rainfall events to costs and material availability.
Sand capping originated in the Pacific Northwest, a region where ample rainfall and poor drainage reduce playability on golf courses. Sand capping began as heavy topdressing programs designed to increase the infiltration rate. This method is still used, and studies indicate a single application of one-quarter to 1 inch of topdressing sand per month has few detrimental effects on turfgrass health or stability. A downside to this method: The exact depth of applied sand capping becomes difficult to estimate and keep consistent over time.
Golf courses currently cap to a known and consistent depth, followed by turfgrass establishment on top of the new sand (Figure 1). At its most extreme, sand capping can take the form of “plating” an entire golf course with 4 to 15 inches of sand.
Sand plays an important role in the construction and renovation of golf courses, particularly putting greens, where it’s chosen for its ability to drain rapidly and maintain surface stability. It’s these desired properties that also make it such a central component of sand capping. Sand is the largest of the soil separates, and when used exclusively, it retains large pores, allowing for free drainage. The more uniform the sand, the more stable the pores; conversely, in nonuniform sands, finer material such as silt and clay can fill gaps between large pores, reducing drainage. Once properly compacted, pore-size distribution in sand changes little when exposed to frequent traffic, so desirable large-pore spaces are retained.
How deep?
Determining how deep a sand cap should be is critical when using this technique. The question of the optimum capping depth currently lacks a standardized answer. Potential methods to calculate capping depth have been suggested, and superintendents can find a comprehensive breakdown of these methods in “Applied Soil Physical Properties, Drainage, and Irrigation Strategies.” When reviewing these methods, most use a moisture-retention curve to predict capping depth.
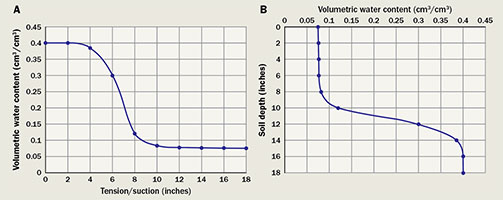
Moisture-retention curves can be rotated so saturation is at the bottom (18 inches), providing an idea of how water tension behaves throughout the soil profile. Graph B is identical to graph A, except it has been rotated to show how volumetric water content increases as one goes deeper in the soil profile.
A moisture-retention curve helps visualize the relationship between soil water content and soil water matric potential (or tension). Matric potential is a negative pressure (suction) responsible for binding water in soil pores and occurs because of attractive forces such as adhesion and cohesion. When all pores are filled with water, i.e., the soil is saturated, soil pressure potential becomes positive. Figure 2 shows a moisture-retention curve for a USGA-specified sand.
Zero tension on the x-axis means the soil is saturated. At this point, volumetric water content is the same as pore space. As tension (suction) initially is imposed on the soil, water is not removed because capillary and absorptive forces holding water are too great. Increasing tension to approximately 5 inches creates sufficient suction to empty the largest pores. In uniform textured soils, a characteristic drop in water content occurs at a point called the air entry point (approximately 5 inches in Figure 2), which is where air first displaces water in a previously saturated soil. As tension increases, water begins to drain from smaller pores. Eventually, pore size becomes small enough that increasing tension does not remove any additional water.
Other points of interest on moisture-retention curves are field capacity and wilting point. Field capacity is the quantity of water that remains in a soil after it has been saturated then left until free drainage ceases; as such, a moisture-retention curve represents a soil at field capacity, showing a characteristic increase in water content with depth. Wilting point is the point after which the soil water is bound too tightly in the soil pores for plants to access it. At this point, plants begin to wilt and eventually will die if the soil water is not replenished.
In terms of applying moisture-retention curves to the turfgrass world, tension can be thought of as soil depth. Assuming the soil is saturated at the bottom, you can find zero tension (saturation) at the bottom of the profile, with tension reduction toward the soil surface. Soil depth dictates the tension at which the graph stops. In order to visualize this, you can flip the moisture-retention curve around its axis and rotate it 90 degrees (Figure 3). The region above the bottom of the soil (18 inches) is saturated; little air is available for plant growth. There is a perched water table at approximately 14 inches that corresponds to the air entry point of the soil. As one moves up the profile, air space becomes more available for plant roots, as evident from the increasing space to the right of the graph line. Nearing the top of the profile, the soil becomes dry. Sand-cap depth is a balance of having sand shallow enough to make capping financially viable but deep enough to provide sufficient air for plant growth toward the soil surface.
Air-filled versus water-filled
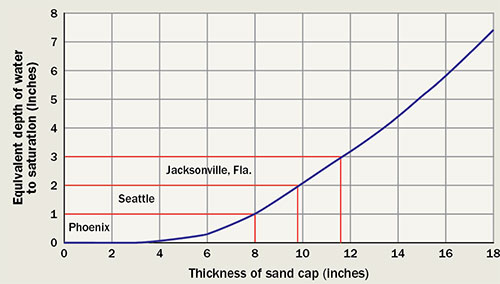
Sand-cap depths required to accept worse-case scenario rainfall for Phoenix (1 inch), Seattle (2 inches) and Jacksonville Fla., (3 inches), using a method created at Clemson University.
In many previously mentioned methods of calculating capping depth, we’ve used air-filled porosity to estimate cap depth rather than water-filled porosity. Air-filled porosity is just the reciprocal of water-filled porosity, as any pore space not occupied by water is assumed to be filled with air. Nearly all the methods require a specific air-filled porosity or a range of air-filled porosities to be met; the depth at which this occurs correlates in some way to the depth of the cap. The reasoning behind this is that superintendents can pick a capping depth that provides sufficient air-filled porosity.
This initially sounds like a good idea, as it’s possible to pick a depth at which sufficient air-filled porosity is present for drainage and plant growth. Unfortunately, this does not take into consideration the slope of the curve after the air entry point. Moisture-retention curves made using sand have extremely steep slopes after the air entry point, as can be seen in Figure 2. This means that despite the soil having the required air-filled porosity, there is actually insufficient air volume in the soil to accept more water or for plant growth.
A method created at Clemson University uses information from moisture-retention curves to calculate the cumulative volume of air available in the soil and uses this to predict how much additional water the soil can hold at certain depths before saturation is reached (Figure 3). In this way, we can engineer sand caps for a worst-case rainfall scenario or just to be able to hold an additional known quantity of rain. A downside of the method is that it assumes the worst-case scenario of the bottom of the soil being saturated.
We suggest 50- or 100-year maximum rainfall events as starting points for determining worst-case scenarios.
Figure 4 shows the capping depth required for three U.S. cities with differing worst-case scenario rainfalls averaged over 50 years. Phoenix averages a heaviest rainfall of about 1 inch per day. Using Figure 3, we can correlate this to a sand-cap thickness of 8 inches. In the same manner, Seattle averages a worse-case rainfall of about 2 inches per day, correlating to a capping depth of 10 inches. Jacksonville, Fla., has the highest average rainfall of the three cities, about 3 inches per day, and as such, correlates to the deepest sand cap required — 12 inches.
It’s important to note that drainage is not a closed system and that soils continue to drain during rainfall events if there is an available outlet. Because of this, space to accept water continuously will be made available in the soil as it drains.
Sand capping is a good way of improving drainage on poorly draining golf courses. However, it’s difficult to decide on a capping depth as there is currently no standardized method of deciding how deep to cap. Many methods use moisture-retention curves in estimating capping depth but often underestimate how deep to cap because of steep slopes found in curves of sands used in capping. But using a method that calculates available soil volume to accept more water as described in this article means superintendents can obtain a better estimate of capping depth.
Philip Brown, Ph.D., is a post-doctoral turfgrass scientist, and Bert McCarty, Ph.D., is a turfgrass scientist at Clemson University. You may reach Brown at phil_james_brown18@yahoo.com for more information.
Subscribe to Golfdom

If you enjoyed this article, subscribe to Golfdom to receive more articles just like it.