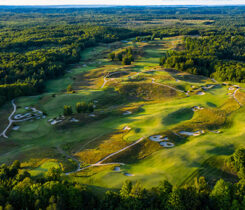
Off the Record: What we can learn from golf’s battle with nitrogen leaching
In my first undergraduate soil course, the professor described nitrogen (N) as the ‘gas pedal’ for plant growth. Indeed, in the 1970s, inorganic N fertilizer was relatively inexpensive, and most sports turfgrass recommendations were much higher than they are today.
During that time, there was little concern about N leaching through a turfgrass root zone. It was the growth and color response that most managers had an interest in obtaining.
By the late 1980s, golf courses were under attack for polluting groundwater with increased nitrate levels. While nitrate results from an EPA study of Cape Cod golf courses were encouraging for the industry, some golf courses did increase nitrate concentrations in groundwater at several locations.
In 1986, the Cape Cod course using the highest proportion of slow-release N fertilizers had the lowest concentration of nitrate-N in groundwater. The golf course with the greatest nitrate-N groundwater concentrations applied more water-soluble N.
In 1987, reducing nitrogen applications significantly reduced groundwater concentrations of nitrate-N at the same Cape Cod courses.
Time for testing
The USGA started to evaluate the fate of pesticides and fertilizers in 1990. Most studies were on relatively young turfgrass, and N leaching was insignificant. For example, in a 1991 lysimeter study at Michigan State University (MSU), Eric Miltner, a doctoral graduate student under Bruce Branham, Ph.D., used the labeled ‘15N’ to track the fate of N for two years.
Miltner and Branham found about half of the applied urea-N was in leaf tissue and removed by mowing. The other half was organic N, with 21 percent in the thatch, 21 to 31 percent in the soil and less than half a percent in leachate.
From 1994 through the spring of 1998, the lysimeter area at MSU received 3 lbs. N per 1,000 ft. sq., but no sampling for N analysis occurred.
From 1998-2002, the high N rate (5 lbs. per 1,000 ft. sq. annually) saw a dramatic increase in nitrate-N leaching from 5 ppm in 1998 to 25 ppm in 2002. During the same time frame, there was a modest increase in nitrate-N leaching for the low N rate (2 lbs. per 1,000 ft. sq.) from 3 ppm in 1998 to 5 ppm in 2002.
Return to form
In 2003, Kevin Frank, Ph.D., changed the high annual N rate to 4 lbs. N per 1,000 ft. sq., and the low N rate remained the same. The concentration of nitrate-N leaching from the high N rate treatment started to decline by 2004.
Over the next 14 years, the nitrate-N concentration in leachate from the high N rate decreased dramatically to the point that the concentrations in leachate in 2007 were similar to those initially measured in 1998.
There was no significant difference in the visual quality throughout the 20 years of the MSU study. This emphasizes the need to find a way to balance inorganic N (immobilized) with available N (mineralized). Too much readily available N from water-soluble sources is a potential problem.
A 1980 study by Cornell University of 125 golf courses ranging in age from 1 to 125 years old suggests soil organic matter accumulation is rapid in the first 10 years after establishment and slowly builds to an equilibrium at 25 years when no further N immobilization occurs. This trend is similar to the long-term carbon sequestration research conducted around the country.
So, the bottom line is that it is valuable to have an easy method that accurately estimates N mineralization rates in older turfgrass soils. This soil test would reduce the potential environmental impact of golf courses and save on fertilizer costs.

Photo: Mike Kenna, Ph. D.
Mike Kenna, Ph.D., retired director of research, USGA Green Section. Contact him at mpkenna@gmail.com.
Subscribe to Golfdom

If you enjoyed this article, subscribe to Golfdom to receive more articles just like it.