How a modified TDR affects surface moisture estimation on putting greens
Managing root zone moisture is critical to both the health and performance of sand-based golf course putting greens. Ensuring adequate water for root uptake while preserving firm, dry surfaces is an ever-present challenge.
Time domain reflectometry (TDR) has become an accepted technology for obtaining objective, nondestructive volumetric water content measurements (VWC) of putting greens. However, portable TDR meters cannot describe VWC near the surface, the region that ultimately defines putting green quality.
This is because a minimum rod length is required for portable TDR devices to produce reliable, accurate measurements (7). This requirement has limited the ability to bring VWC measurements closer to the putting surface.
From a manufacturer’s perspective, the issue involves limitations with the TDR meter’s circuitry.
In research, errors with short rods are particularly problematic in dry soils (7). For putting greens seeking dry surfaces, an alternative approach involves taking the current minimum length and blocking the penetration depth of the rods to focus measurements closer to the surface.
This impermanent adaptation to a portable TDR meter could preserve the minimum rod length and allow a single device to measure VWC rapidly at multiple depths and locations.
This research aimed to expand the measurement capabilities of an existing TDR meter to estimate VWC in the uppermost half and 1 inch of sand-based putting greens. The hypothesis was that we could correlate the raw travel time of the TDR wave to ground truth VWC at 0.5 and 1 inch with the use of spacer blocks.
Materials and methods
We conducted this research at the Milo J. Shult Agricultural Research and Extension Center in Fayetteville, Ark., in 2013 and 2014. We collected samples from sand-based research putting greens constructed according to USGA recommendations (3) and managed under representative maintenance practices for the region.
Turfgrass species and cultivars include creeping bentgrasses Penn G-2 and Tyee, and Tifeagle. Putting green ages ranged from one year (Tyee) to more than 10 years (Penn G-2).
Our team utilized a Field Scout TDR300 Soil Moisture Meter (Spectrum Technologies Inc.) equipped with 1.5-inch-long stainless steel turf rods to gather time domain reflectometry measurements.
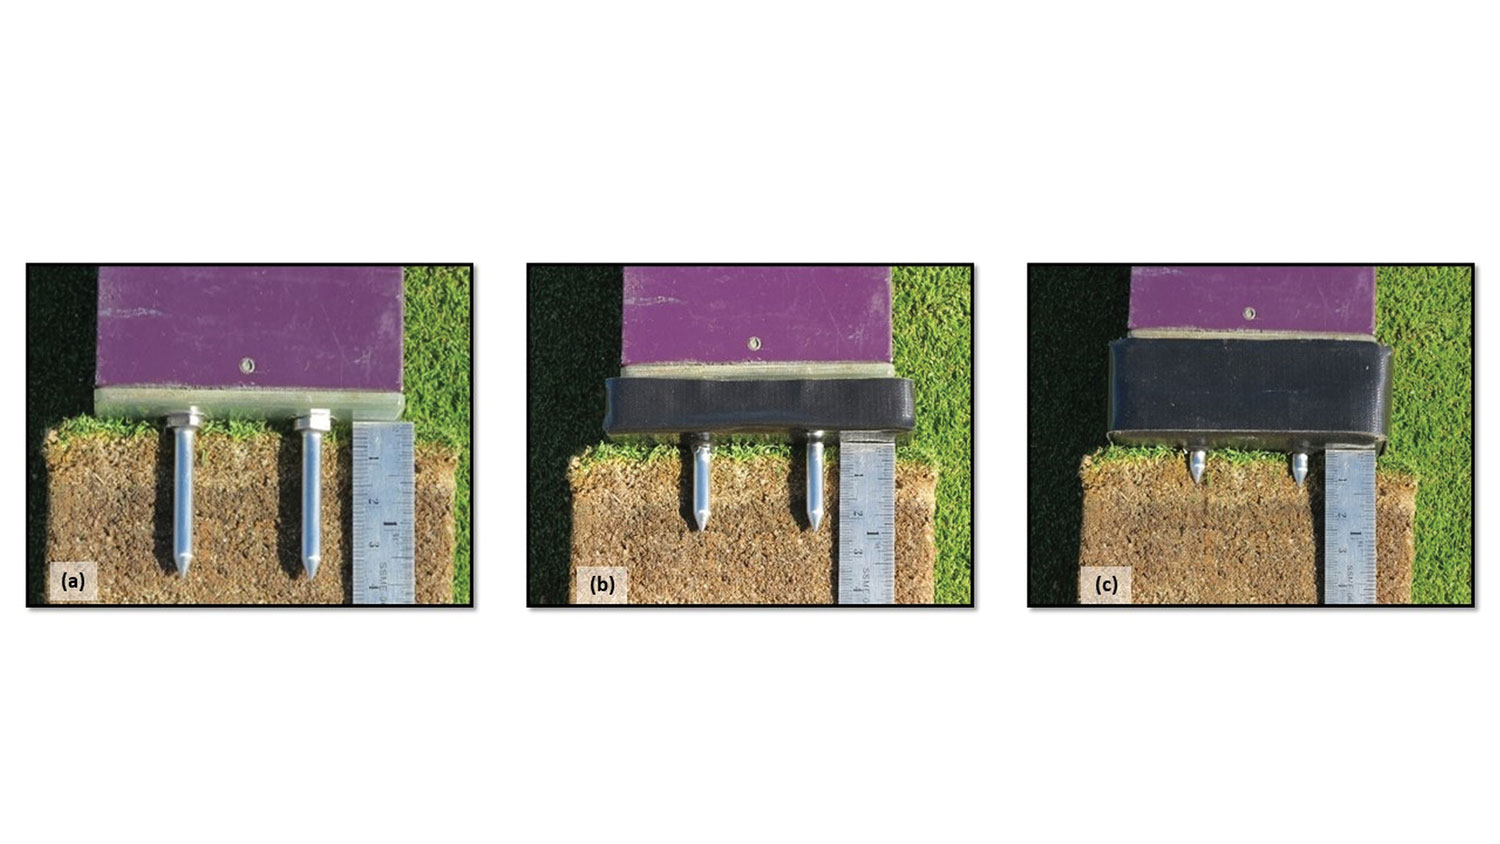
(Fig 1) Field Scout TDR300 Soil Moisture Meter and (a) standard 1.5-inch turf rods. Researchers fit spacer blocks (black) onto 1.5-inch rods to achieve new measurement depths of (b) 1 inch and (c) 0.5 inches. (Photos: Daniel O’Brien, Michael Richardson, Ph.D., and Douglas Karcher, Ph.D.)
We set the TDR300 to Period Mode and reported all measurements in microseconds (μs) and determined independent VWC measurements gravimetrically. We based the procedure on the manufacturer’s soil-specific calibration for maximum accuracy (9).
We achieved new measurement depths of 0.5 and 1 inch with spacer blocks — made from ethylene vinyl acetate (EVA) foam mat wrapped in a double layer of weather-resistant tape — that fit over the base of the TDR300’s 1.5-inch rods. We also drilled two holes in each block, allowing them to fit onto TDR300 rods while avoiding the formation of air pockets adjacent to the rods.
We then extracted 4.1-inch diameter turfgrass samples using a cup cutter and cut them to a uniform depth of 2.5 inches below the soil surface from the greens with a brass cylinder. Critically, we removed no turfgrass tissue and left the verdure intact as a part of the sample.
We saturated all samples at the bottom using deionized (DI) water for 16 hours. Following removal from saturation, all samples dried for various time intervals until we took VWC measurements. The goal was to produce as diverse and well-distributed VWC data as possible. Therefore, there were no fixed intervals or overall time frames for when we collected VWC measurements.
To create as many unique data points as possible, we compared measurements on each sample to those previously recorded and adjusted drying intervals accordingly. We collected Initial measurements < 15 minutes after removing the samples from saturation and continued at the author’s discretion until all samples were measured.
For each sample, we took two separate VWC measurements. First, we inserted the TDR300 fit with one of the spacer blocks into the top of the sample and recorded a Period Mode measurement in μs.
Then, we reinserted the sample into the brass cylinder. We cut it to the corresponding depth of the TDR300 measurement and weighed it to the nearest 0.1 grams. We subsequently dried cut selections at 105 degrees C for 24 hours and reweighed to calculate ground truth VWC according to Equation 1:
VWC = (M1−M2) ∕ (ρw × V ) (1)
Where M1 was the initial mass of the cut section, M2 was the mass of the oven-dried section, ρw was the density of water, and V was the volume of the cut section.
Following gravimetric VWC measurements, we determined the total organic matter (OM) present in each sample through the loss on ignition (LOI) method (1).
Additionally, we created a two-point calibration model for each new measurement depth. The TDR300 fitted with spacer blocks recorded Period Mode measurements in air and DI water.
(Fig 2)
We took three measurements in the air and three measurements with only the exposed portion of the rods in DI water and calculated the average μs value for each. Our team conducted the process separately for the 0.5 and 1-inch spacer blocks. We used values of 0 and 1 for the VWC of air and DI water, respectively.
We then developed prediction models for each depth using SAS PROC REG (SAS 9.4, SAS Institute Inc.). And plotted Period Mode readings on the x-axis and gravimetrically determined VWC on the y-axis.
We collected and processed samples on three separate occasions. Each putting green sample served as a single unit for either 0.5 or 1 inch.
Results and discussion
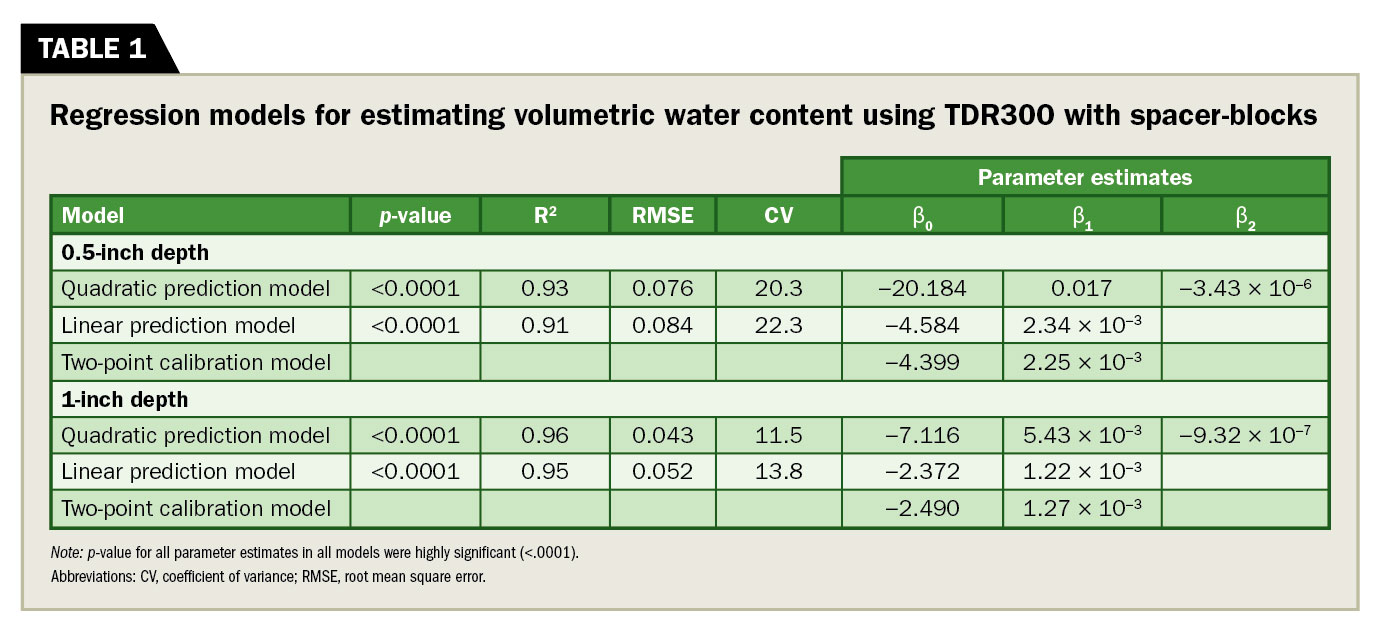
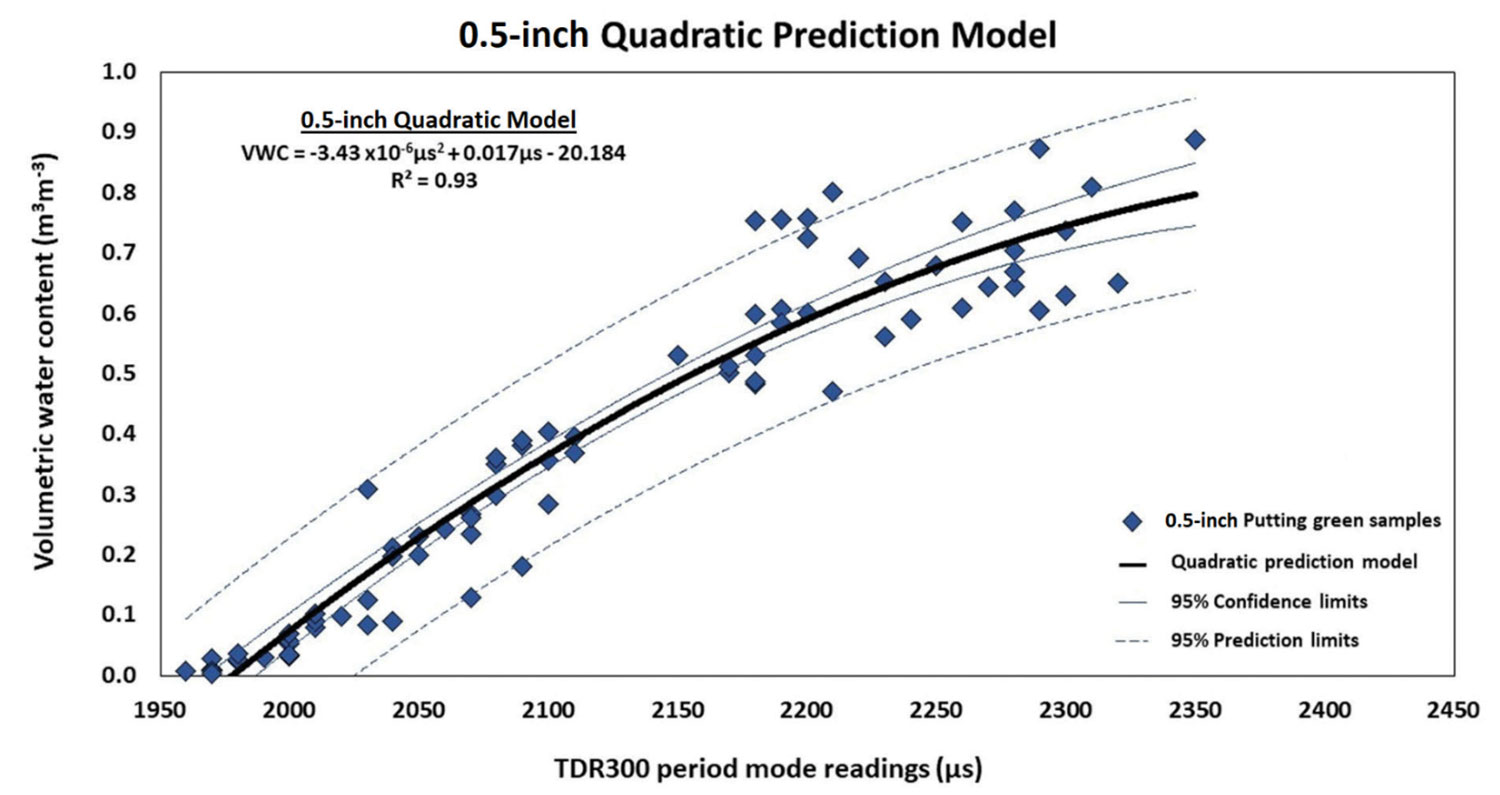
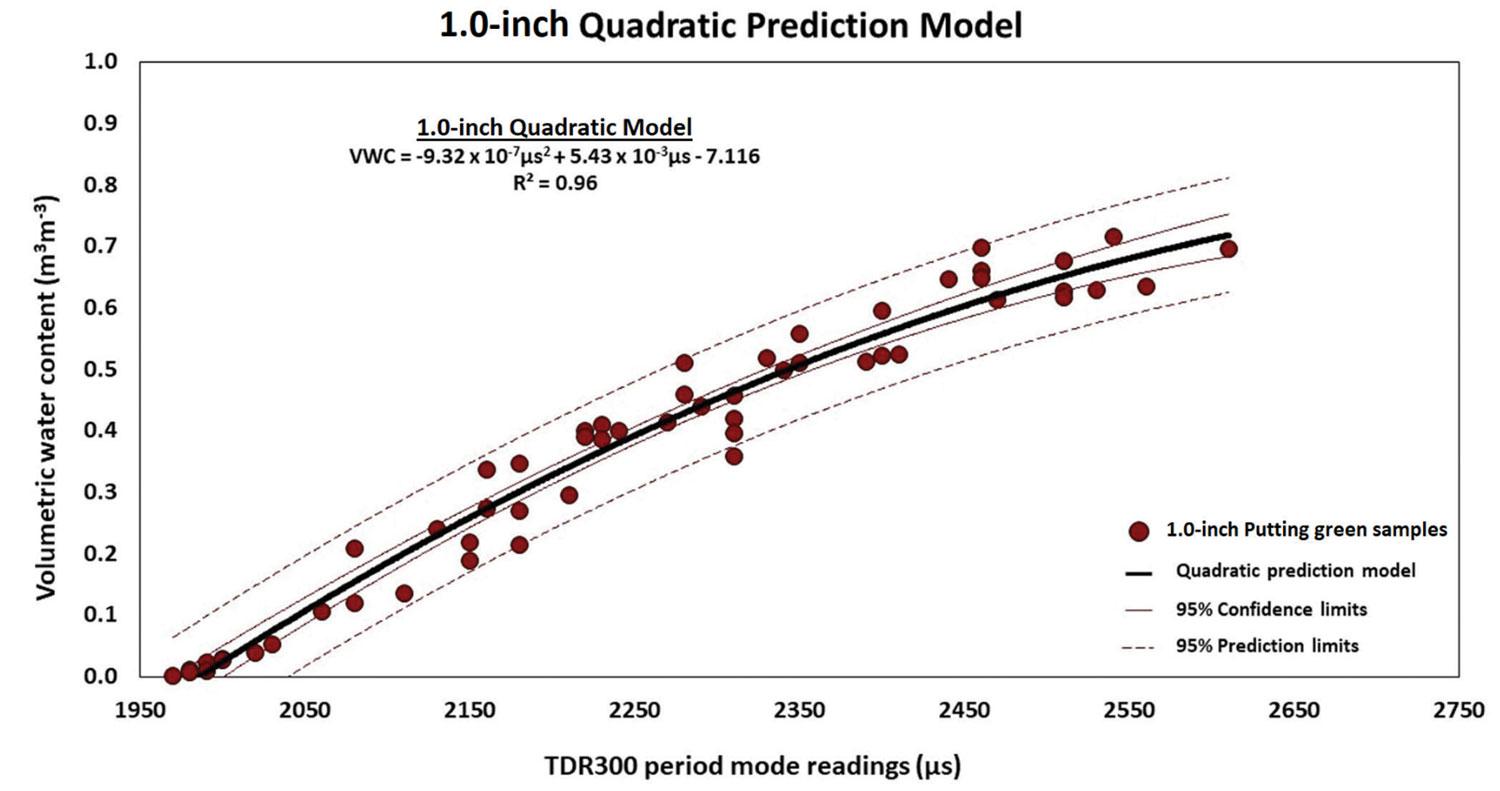
At both 0.5 and 1-inch, TDR300 spacer block measurements were highly significant (p <.0001) predictors of VWC within putting green samples (Table 1). For both 0.5 and 1-inch data sets, we ultimately selected a quadratic prediction model (Figures 2 and 3).
Quadratic models and all parameter estimates were highly significant (p <.0001), with R2 values of 0.93 and 0.96 at 0.5 and 1-inch, respectively. These results indicated that with this modification to an existing moisture meter, we could estimate VWC at shallower depths closer to the surface of sand-based putting greens.
At 0.5 inches, we used 80 total samples to construct prediction models. Within these samples, VWC ranged from 0.01 to 0.88 m3 m−3 (mean = 0.38; median = 0.36), and TDR300 Period Mode readings ranged from 1970 to 2350 μs. Organic matter content ranged from 0.04 to 0.20 g g−1 (mean = 0.11; median = 0.12). We based our 0.5-inch two-point calibration model on μs values of 1953 and 2397.
At 1 inch, we used 55 samples to construct prediction models. Volumetric water content ranged from 0.01 to 0.72 m3 m−3 (mean = 0.38; median = 0.40), and TDR300 measurements ranged from 1970 to 2610 μs. Organic matter content ranged from 0.02 to 0.16 g g−1 (mean = 0.08; median = 0.07). We based the 1-inch two-point calibration model on μs values of 1957 and 2743.
The 1-inch models resulted in greater R2 values, with reduced RMSE compared to 0.5-inch models. This was not surprising, given the 50-percent longer rod length for differentiating TDR signal travel time.
The 95 percent prediction limits evidenced greater variability in estimating VWC at 0.5 inches. Nonetheless, the highly significant relationship (p <.0001) at 0.5 inches indicated that the TDR300 could estimate VWC at depths as shallow as 0.5 inches. It is important to interpret VWC appropriately as it applies to the samples in this research. Volumetric water content is traditionally understood as “soil VWC,” implying that it represents the water contained within the pore space of the soil.
Solid soil constituents are generally considered to be approximately 50 percent of the overall volume, so maximum soil VWC becomes limited to the remaining approximately 50 percent. In this research, VWC was >70 percent at 1-inch and >80 percent at 0.5-inch depth. These larger, gravimetrically determined VWC values reflected the fact that samples included water within living plant tissue and accumulated OM, in addition to root zone pore space.
(Fig 3)
As we estimated VWC at increasingly shallow depths, plant tissue and OM became even greater proportions of the overall sample. When comparing 0.5- and 1-inch VWC to other standard TDR300 measurement depths it is important to appreciate that prediction models for other TDR depths may not have included water within living turfgrass plant tissue.
We constructed prediction equations in this research as single-step models relating TDR travel time directly to VWC for the expressed purpose of providing models that were intuitive to end users. Single-step calibration models of this type are well-represented in the literature (2,4,5 and 6) and acknowledged as a method for calibrating a specific instrument in a particular situation (8).
Evaluating prediction models
Data were initially fitted with linear models at both depths, taking on the general form:
VWC = β0 + β1μs + ε (2)
Where μs was the Period Mode reading of the TDR300, β0 and β1 were intercept and slope, respectively, and ε was the model error.
At both 0.5 and 1-inch depths, linear models and β coefficients were all highly significant (p <.0001), with R2 values of 0.91 and 0.95, respectively. However, linear models at both depths consistently overestimated VWC at water content <0.20 m3 m−3 (data not shown).
This overestimation led to the evaluation of alternative prediction models. To better estimate VWC at <0.20 m3 m−3, a β2 term was added, creating quadratic prediction models of the general form:
VWC = β0 + β1μs + β2μs2 + ε (3)
For each depth, quadratic models reduced overestimation and created a more balanced distribution of studentized residuals at VWC < 0.20 m3 m−3, producing 18 positive and 23 negative residuals without compromising random scatter of residual values at greater VWC (data not shown).
Quadratic models themselves and all β coefficients were highly significant (p <.0001). For both depths, quadratic models increased R2 values and reduced RMSE and CV compared to linear models (Table 1). In summary, the β2 term offered meaningful contributions to characterizing the relationship between TDR300 measurements and VWC at both of the new shallower depths.
Conclusions
The use of EVA spacer blocks provides a simple method for expanding a TDR300’s measurement capabilities to include new shallower depths of 0.5 and 1 inch.
At both depths, there was a highly significant relationship between Period Mode measurements in μs and ground-truth VWC of putting green samples.
We assessed linear, quadratic and third-order polynomial models. We ultimately selected quadratic models for both depths as they demonstrated an improved ability to relate TDR measurements to VWC at the lower end of the observed range.
Generally, 1-inch VWC estimations tended to be more accurate. A two-point calibration based on air and DI water offers a simplified alternative to constructing empirically derived linear models. However, as with other linear models, the two-point calibration tended to overestimate VWC for water content <0.20 m3 m−3.
Multiple turfgrass varieties, species and putting green ages were well-represented by a single prediction model at each depth. The improved model performance occurred when OM <0.10 g g−1.
Subscribe to Golfdom

If you enjoyed this article, subscribe to Golfdom to receive more articles just like it.