What causes snow mold?
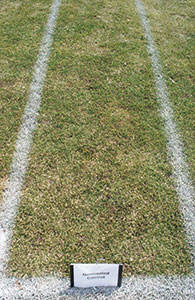
Figure 1
(Hint: it’s more than snow)
For most of the country, the winter of 2013-2014 was one to forget… or to remember and hope it never happens again. Brutal cold swept from the Midwest down to the gulf coast, and the term ‘polar vortex’ exited the nerdy world of meteorology and entered the popular vernacular.
For turf managers this meant significant difficulties — from devastating ice injury in parts of the Midwest and Northeast to desiccation injury in the central plains to direct low temperature kill of ultradwarf bermudagrass in the South.
But what about snow mold? Many areas of the country saw more snow and had longer durations of snow cover than they had seen in decades. Parts of the Northeast and mid-Atlantic were bracing for widespread gray snow mold… a rarity in those parts. Much of the Midwest had over 90 days of consecutive snow cover, with cities in Wisconsin such as Madison and Milwaukee approaching records for the duration of snow cover and the widespread expectation that snow mold would be severe.
But when the snow melted, many places barely had any snow mold at all. Still others, seemingly not far away, experienced significant snow mold damage.
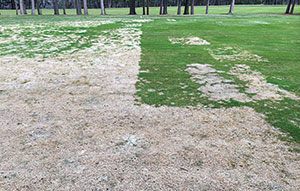
Figure 2
Why the discrepancies? What led to severe damage in one location and very little in another just an hour or two away? And what did we learn from last year’s research that can help protect us this year?
The Wisconsin example
As luck would have it, for the first time last fall we decided to install data loggers at three of our five snow mold research sites in Madison, Wis., Wausau, Wis. and Marquette, Mich. These data loggers measured hourly temperature, relative humidity, dew point and sunlight at the turf surface and soil temperature at a two-inch depth. Despite 90 days of continuous snow cover, the site in Madison was basically free of snow mold over the entire site (Figure 1).
Our site two hours north in Wausau however, had extreme pink snow mold (Figure 2). Our site four hours north of that in Marquette, had extreme speckled snow mold (Typhula ishikariensis) (Figure 3).
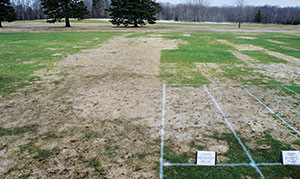
Figure 3
If all three sites had extended periods of snow cover, why did only the two northern sites have snow mold? And why did disease pressure go from nonexistent in Madison, to such an extreme level in the relatively short drive to Wausau?
The short answer is temperature. The surface temperature under snow cover at the Madison site was consistently below 30°F and varied considerably as the air temperatures above the snow fluctuated (Figure 4). Wausau and Marquette are two and four hours north of Madison, respectively, and experienced significantly colder air temperatures than Madison. However, the surface temperature at both sites under the snow was highly consistent for most of the winter at approximately 30-32°F.
Despite their cold-loving nature, snow mold fungi do not grow (and certainly don’t infect turf) when temperatures are well below freezing. The relatively moderate increase in temperature between the Madison and Wausau/Marquette sites was enough to allow for prolonged optimal infection conditions for the fungus and extreme snow mold development.
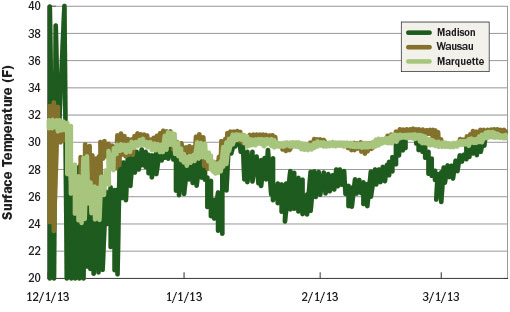
Figure 4 (click to enlarge)
Surface temperatures under snow cover during the winter of 2013-2014 from research sites in Madison, Wis.; Wausau, Wis.; and Marquette, Mich.
The logical follow-up question is if all three sites had consistent snow cover, why was the surface temperature at Madison so much lower than the other two? Though we don’t have an exact answer, the most likely explanation is in the depth of snow cover.
We know that snow is an excellent insulator. Previous research conducted at Wisconsin has found that surface temperatures under snow cover can be 55°F higher than areas without snow. But the amount of insulation clearly depends on the depth and type of snow cover. Snow depth in Madison averaged between four and eight inches throughout most of the winter, while the snow depth was well over a foot for much of the winter at the northern locations.
The increased depth at the northern sites provided a greater level of insulation against the brutal cold, and an optimal environment for snow mold development.
From this information it seems apparent that if you were able to observe surface temperature under snow in real time you would be able to ‘predict’ the level of snow mold pressure prior to the snow melting. If the data loggers suggest temperatures have been optimal for disease development for a prolonged period, you might decide to remove some of the snow in certain areas, which would theoretically lower the surface temperature and inhibit disease development.
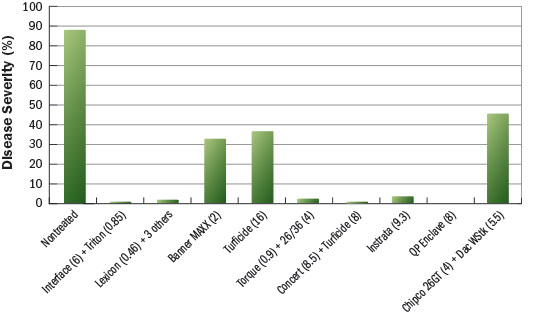
Figure 5 (click to enlarge)
Percent pink snow mold on select treatments assessed
on April 21st, 2014 at Wausau (Wis.) CC.
We intend to experiment with wirelessly transmitting data loggers at our snow mold research sites in 2014-2015 to give us real-time updates on the conditions under the snow. Armed with this information, we hope to provide information on whether the conditions are ripe for snow mold development weeks — if not months — before the snow even begins to melt.
What did we learn last year?
Only a small portion of last year’s snow mold research is discussed here, but the full results from the 2013-2014 University of Wisconsin Snow Mold Trials can be found at www.tdl.wisc.edu/results. The trials last year included results from five sites across Wisconsin, Minnesota and the Upper Peninsula of Michigan. Though varying pressure was present at each of the five sites, except Madison, there was extreme snow mold pressure in both our Wausau (87.5 percent in non-treated control) and Marquette (95 percent in non-treated control) trials.
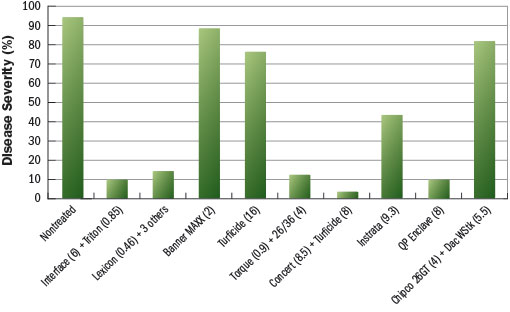
Figure 6 (click to enlarge)
Percent speckled snow mold on select treatments assessed
on April 23rd, 2014 at Marquette (Mich.) CC.
The main takeaway from the research is that despite heavy disease pressure, numerous treatments provided exceptional disease protection. In Wausau, where pink snow mold was the primary disease present, 54 of the 108 treatments provided over 90 percent control and 15 of those treatments provided over 98 percent control (Figure 5). In Marquette, where speckled snow mold was the primary disease present and pressure was even more extreme, there were still 12 different treatments that provided over 90 percent control (Figure 6). Most of the treatments providing exceptional protection were combinations of three, four or even five active ingredients. Exceptional treatments included, but were not limited to: Instrata, Interface + Triton FLO, Torque + Turfcide, Concert + Turfcide, Torque + 26/36, QP Enclave and Lexicon + Trinity + Daconil Ultrex + Chipco 26GT.
Looking at the results, it is clear that multiple active ingredients are required for acceptable snow mold suppression under heavy disease pressure. Last year’s research vividly demonstrates this point with numerous head-to-head comparisons of the combinations versus their single active ingredients. For example, the combination of Interface at 3.0 fl. oz. per 1000 ft2 and Triton FLO at 0.75 fl. oz. per 1000 ft2 provided over 96 percent control in our Wausau trial (Figure 7). However, Interface alone provided only 37.5 percent control, while Triton FLO alone provided just 68.7 percent control. In another example, Torque (0.9 fl. oz. per 1000 ft2) and 26/36 (4.0 fl. oz. per 1000 ft2) provided over 98 percent control in the Wausau trial (Figure 8). But 26/36 alone only provided 28 percent control and Torque alone only provided 66 percent control. These examples demonstrate that even the addition of a single active ingredient to the fungicide mixture can make a huge difference in the level of control obtained.
I would like to close by thanking the superintendents at the five courses that hosted our trials in 2013-2014: Matt Mckinnon at Craguns Resort, Craig Moore at Marquette GC, Norma O’Leary at Silver Bay GC, Randy Slavik at Wausau CC and Mark Watts at Tumbledown Trails GC. Without their hospitality our research would be impossible.
Photos: Paul Koch
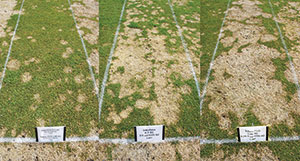
Figure 7
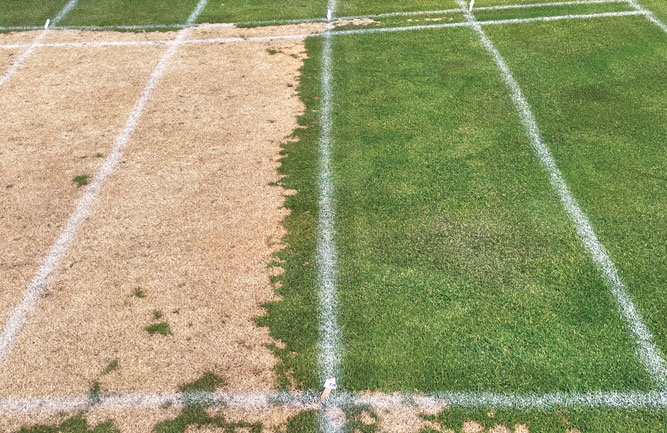
Comparison of Interface and Triton FLO applied as a tank-mix (left) to Interface (center) and Triton FLO (right) applied alone at Wausau CC on April 21, 2014.
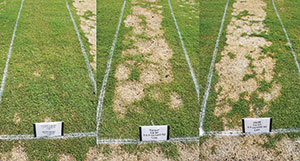
Figure 8
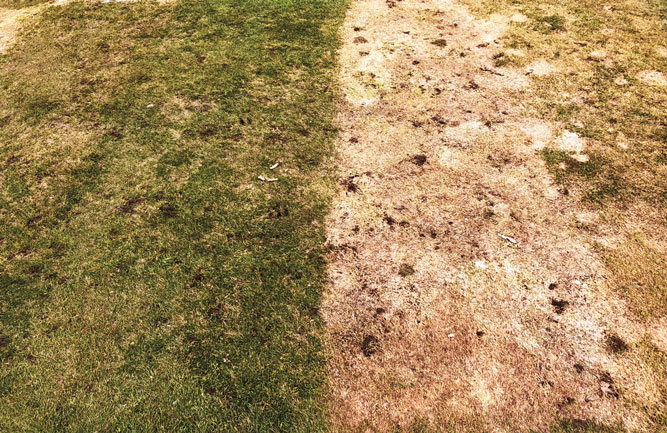
Comparison of Torque and 26/36 applied as a tank-mix (left) to Torque (center) and 26/36 (right) applied alone at Wausau CC on April 21, 2014.
Subscribe to Golfdom

If you enjoyed this article, subscribe to Golfdom to receive more articles just like it.