Fungicide effectiveness for disease control on creeping bentgrass fairways
NOTE: In these studies, we applied treatments at 14-day or 21-day intervals and did not rotate them. This common method in field fungicide evaluation trials doesn’t appropriately mirror actual practice on golf courses, mitigate fungicide resistance development or adhere to labeled season usage limits. We did not apply any fungicide treatments within the labeled season usage rate in these studies. For example, Maxtima’s label recommends application four times at the 0.4 fl. oz./1,000 sq. ft. rate, whereas in these trials, the same plot received eight or more treatments of Maxtima (BASF, mefentrifluconazole). Additionally, we inoculated and subjected plots to environmental conditions that resulted in extremely high disease pressure. Last, when comparing products examine the labeled use rate, amount of active ingredients and application intervals. These are key aspects to consider when evaluating product evaluation trials and developing a fungicide program at your facility.
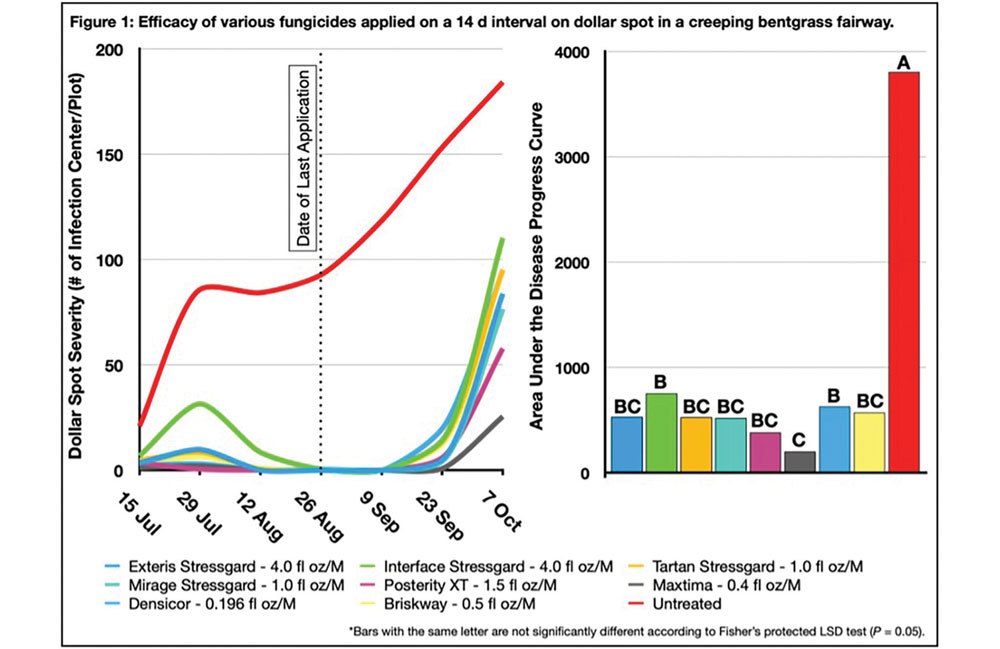
Figure 1
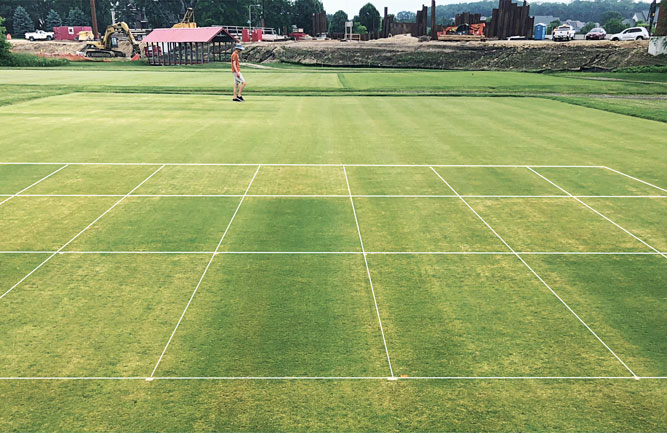
In 2021, we conducted three fungicide trials to evaluate preventive dollar spot (Clarireedia spp.) and brown patch (Rhizoctonia solani AG2-2 IIIB) control at the University of Missouri Turfgrass Research Facility in Columbia, Mo. We conducted all trials on Penneagle II creeping bentgrass grown on native Mexico silt loam soil. We also mowed plots at 0.675 inches two times weekly from early April to mid-October.
We applied nitrogen as Signature fertilizer (18-2-18) on April 9 at 0.5 lb. N/1,000 sq. ft. From April 28 to May 26, every two weeks, we applied NBN-30 (30-0-0) at 0.1 lb. N/1,000 sq. ft., Primera One (20-20-20) at 0.01 lb. N/1,000 sq. ft. and Primo Maxx (tranexamic-ethyl, Syngenta) at 0.125 fl. oz./1,000 sq. ft. From June 11 to Sept. 17, we reduced NBN-30 (30-0-0) to 0.05 lb. N/1,000 sq. ft. and Primera One (20-20-20) to 0.005 lb. N/1,000 sq. ft. We applied Zipline (Aquatrols) at 8.0 fl. oz./1,000 sq. ft. to reduce localized dry spot on Aug. 18 and Sept. 17.
On June 11, rye grain (Secale cereale L.) infested with the dollar spot and brown patch pathogen was uniformly applied using a broadcast spreader at a volume of 1.22-inches3 and 1.52-inches3, respectively. We left rye grain on the turf surface for three days before mowing.
April 15 was the initial date for Trial 1, followed by May 6 for Trials 2 and 3. We arranged 5-by-5-foot plots in a randomized complete block design with four replications for all three trials. We applied products in water equivalent to 1 gal./1,000 sq. ft. with a CO2-powered sprayer at 26 psi using four TeeJet 8004 flat fan nozzles.
We assessed disease severity every 14 days from initial symptom development, with brown patch severity assessed as a visual estimate of the percent symptomatic area and dollar spot assessed by counts of infection centers per plot. We subjected data to variance and means separation analysis using Fisher’s protected LSD (P = 0.05). The area under the disease progress curve combines disease severity ratings and overall rating dates and we calculated that with the trapezoidal method.
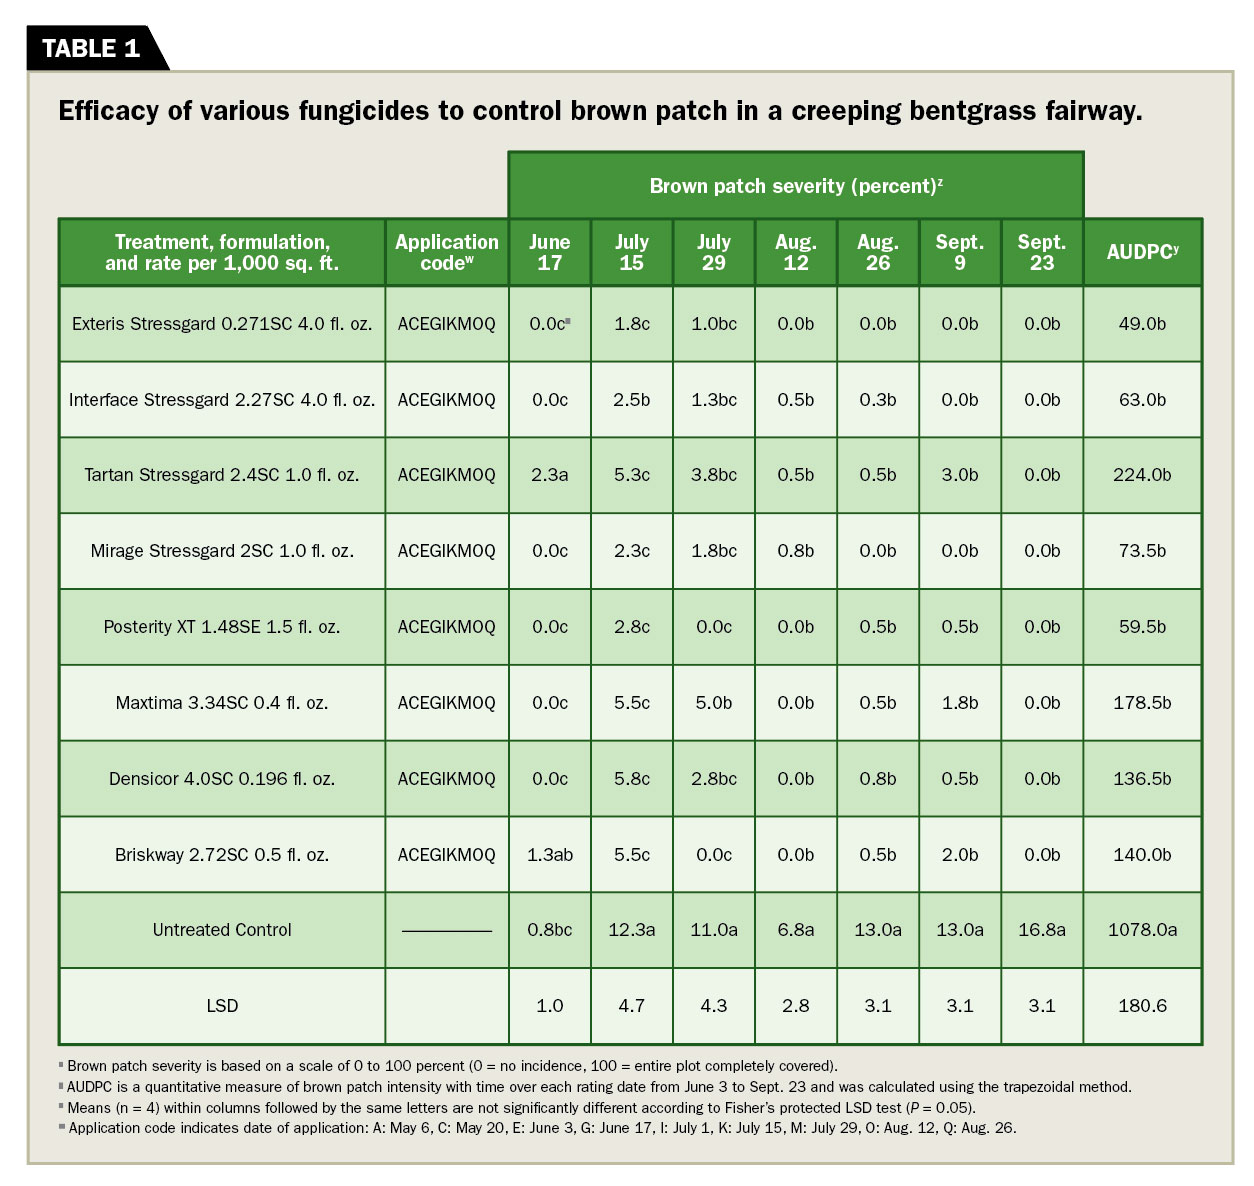
Table 1
Trial 1: Multiple fungicides at 14-day intervals
We applied fungicides at 14-day intervals from May 6 through Aug. 26. We first observed dollar spot and brown patch in plots on June 3. Dollar spot severity escalated in the middle of July and progressed throughout the season. All fungicide-treated plots had fewer incidences of dollar spot than untreated plots throughout much of the study. Interface-treated plots saw more dollar spot than other fungicide-treated plots on July 29 and more than on Maxtima, Densicor (Envu, prothioconazole), and Briskway (Syngenta, azoxystrobin and difenoconazole) treated plots on July 15 (Figure 1).
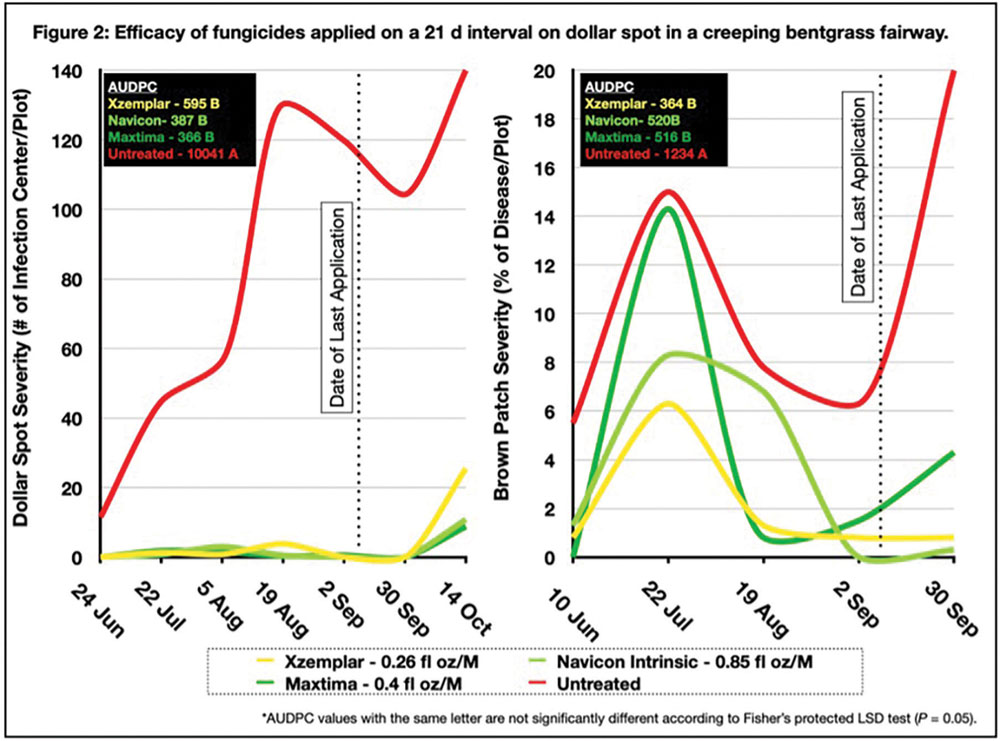
Figure 2
Maxtima treated plots had lower dollar spot AUDPC values than Densicor and Interface-treated plots, caused by an extended window of control for four weeks (Sept. 23) and six weeks (Oct. 7) after we suspended the fungicide applications on Aug. 26 (Figure 1).
All treated plots had lower brown patch severity than untreated plots. Maxtima-treated plots had higher brown patch severity than Posterity XT and Briskway-treated plots on July 29. Otherwise, fungicide treatments resulted in similar levels of brown patch control throughout the trial (Table 1).
Trials 2 and 3: 21-day interval applications
Dollar spot was first observed on May 13 in Trial 2 and June 3 in Trial 3. Application date ranges for the two trials differed, with Trial 2 treatments spanning from April 15 through Sept. 9 (eight total treatments) and the Densicor treatment in Trial 3 only being applied from May 6 through Aug. 19 (six total treatments). For this reason, we should not compare treatments in these two trials against each other.
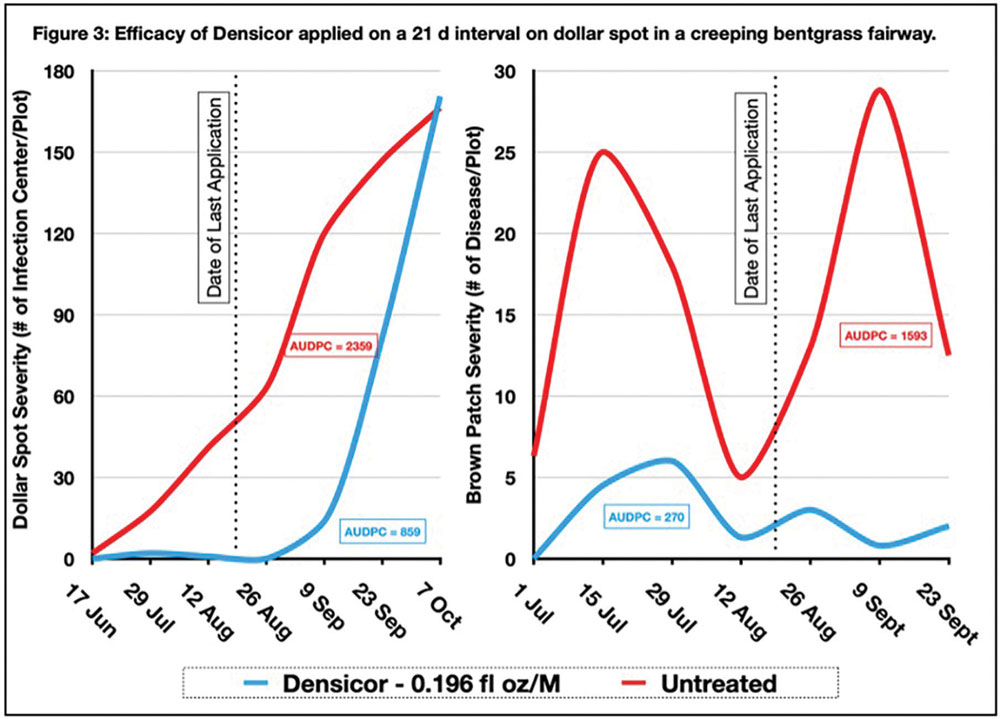
Figure 3
In Trial 2, all treated plots had significantly less dollar spot and brown patch than untreated plots throughout the study. Residual control after the final application on Sept. 9 lasted until mid-October (Figure 2). The brown patch in the Navicon-treated plots was not different from the untreated control on Aug. 19. No differences were found between any of the treatments and the untreated control on July 22.
In Trial 3, Densicor-treated plots applied on a 21-day interval had less dollar spot and brown patch severity than untreated control plots throughout the entirety of the trial (Figure 3). In both trials, dollar spot and brown patch AUDPC values were lower in treated plots than in the untreated control plots.
Daniel Earlywine, research specialist, PARC Research and Consulting, Columbia, Mo., and G.L. Miller, Ph.D., assistant professor, Department of Botany and Plant Pathology, Purdue University. Contact Miller for more information at turfpath@purdue.edu.
Subscribe to Golfdom

If you enjoyed this article, subscribe to Golfdom to receive more articles just like it.